O3GK Instrumental Lines for KAGRA
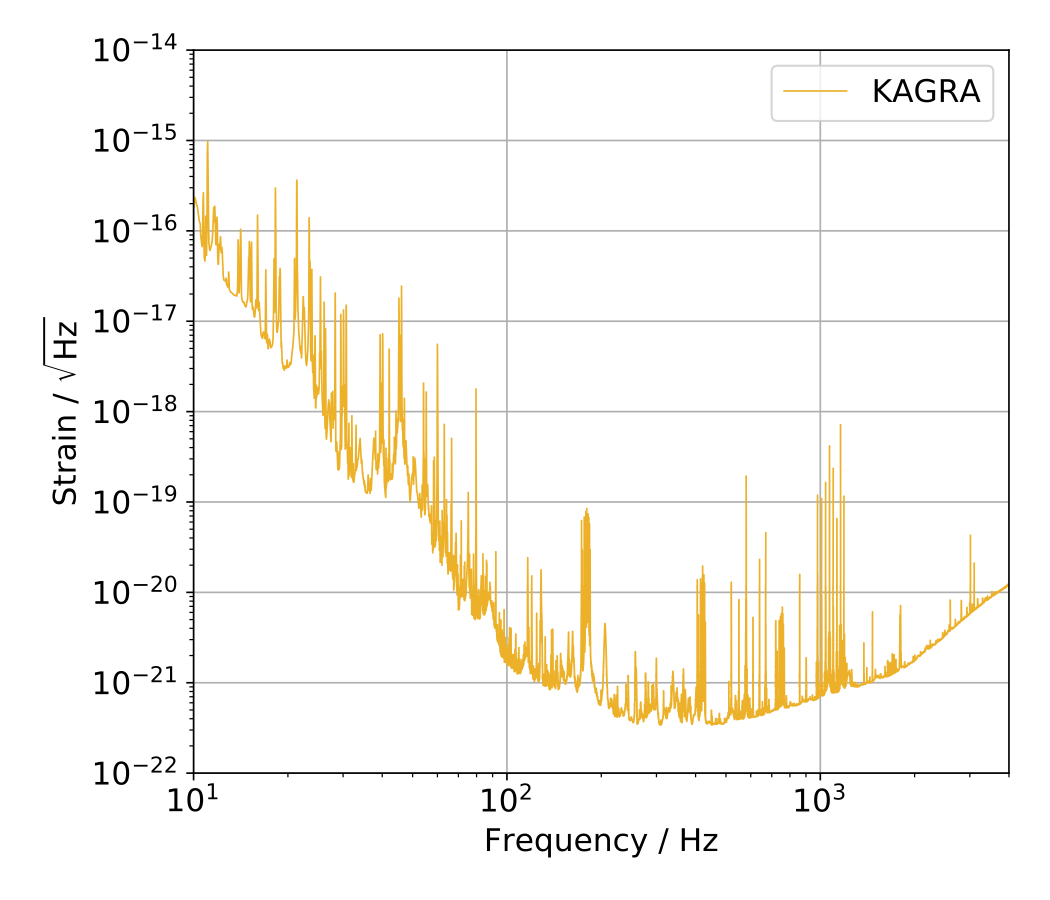
The plot below shows the amplitude spectral density (ASD) of the total strain noise in KAGRA (yellow line) detector (reproduced from the O3GK paper). The curve is the mean sensitivity during O3GK. The plot shows frequency [Hz] on the x-axis, and the ASD value [ 1 / sqrt(Hz) ] on the y-axis.
The spectra reveal a large number of "lines" due to instrumental artifacts:
The most prominent peaks
The peaks that are most noticeable to the eye are all believed to be due to known instrumental effects.
For KAGRA we have:
-
The main AC power at the KAGRA site (located in the west part of Japan) is
100 Vrms, 60 Hz, and all electronics are designed to work with this main
power even after passing through AC-DC converters. This 60 Hz line and its
harmonics can appear in any analog circuits as electrical noise, e.g., in
photodetectors, and actuators.
Eigenmodes of Type-A suspensions
- Five peaks at around 21 Hz, 23 Hz, 40 Hz, 45 Hz, and 55 Hz were identified as the Type-A suspensions' eigenmodes.
Violin modes
- Peaks at around 180 Hz, 420 Hz, and 740 Hz are the first, second, and third standing waves of sapphire fibers that suspend a sapphire mirror at a Type-A suspension.
Lines for Alignnment Dither System (ADS)
- The ETMX, ETMY, IMMT1, BS, PR3, and SR3 were excited in angular degrees of freedom for ADS.
- Due to the imperfect alignment or mis-centered beam spots, the angular excitation is coupled to the length and seen in the sensitivity.
- Excitation frequencies for ETMX and ETMY are chosen to be below 10 Hz, and 20-45 Hz for the other mirrors.
Lines for Beam Position Centering (BPC)
- In addition to the ADS, it was intended to use the local beam centering control, however, no BPC control loop was used during the observing run due to a technical reason.
Calibration lines inserted by moving the end mirrors
- To monitor the time-dependence of the calibration factor of the strain data, the calibration lines are injected in two ways during the observation.
- One is via the coil magnet actuators to control positions and angles of each end test mass mirror. The frequencies are 28.3 Hz and 30.7 Hz for ETMX and ETMY, respectively.
- The other is via the photon calibrator for the X-end test mass mirror with the frequencies at 29.5 Hz, 79.7 Hz, 859.7 Hz.
Lines for MICH/PRCL feed-forward system
- MICH and PRCL were excited at 66.6 Hz and 63.1 Hz respectively to monitor the time-dependence of the transfer function from them to DARM.
References
- "Noise budgets for KAGRA" (in preparation)
Instrumental line catalog
The following files contain lists of prominent spectral line frequencies. Each entry contains the line frequency, artifact type, and comments for each type of artifact. The intent is to identify spectral lines that we are confident are of instrumental (not astrophysical) origin, even if we don't understand the mechanism by which they show up in the strain data; they therefore are safe to ignore or "clean" (remove in an analysis-dependent way) when searching for CW signals.
- Text file line catalogs:
It is likely that you will need to speak with a KAGRA expert to understand the details of what you find in this catalog. You can start by checking our contact page.