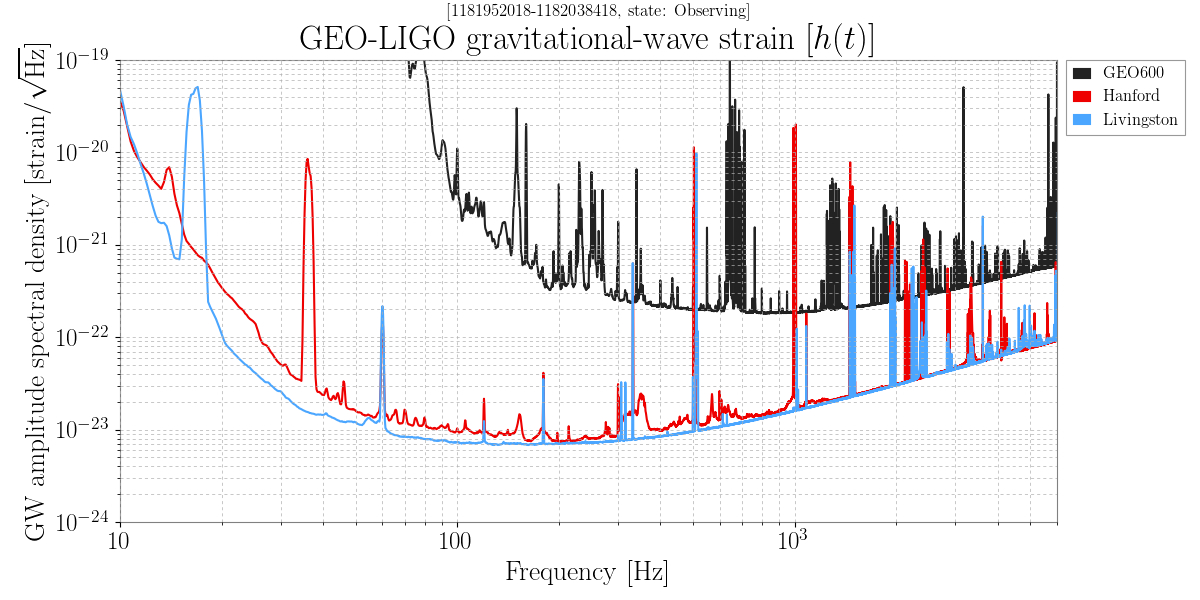
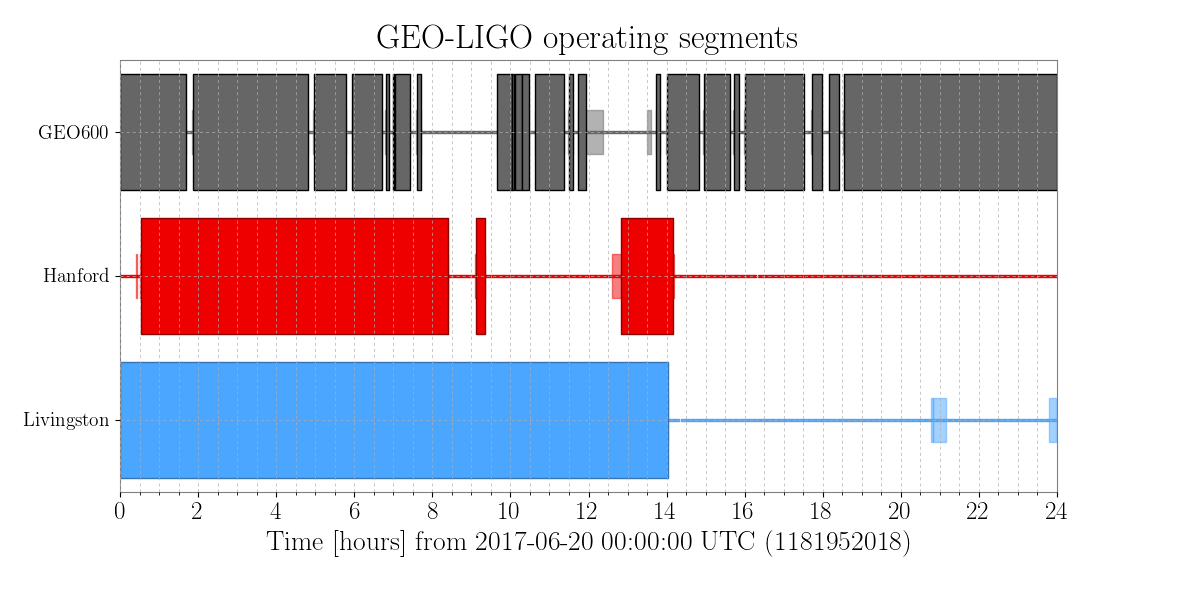
The plots shown below characterize the sensitivity and
status of each of the LIGO interferometers (as well as the
GEO600 detector in Hanover, Germany).
For more information about the plots listed below, click on an image to read the caption.
Use the tabs in the navigation bar at the top of the screen for more detailed information about
the LIGO and GEO interferometers.
This page is a product of the LIGO Open Science Center. See ligo.org for more information.


