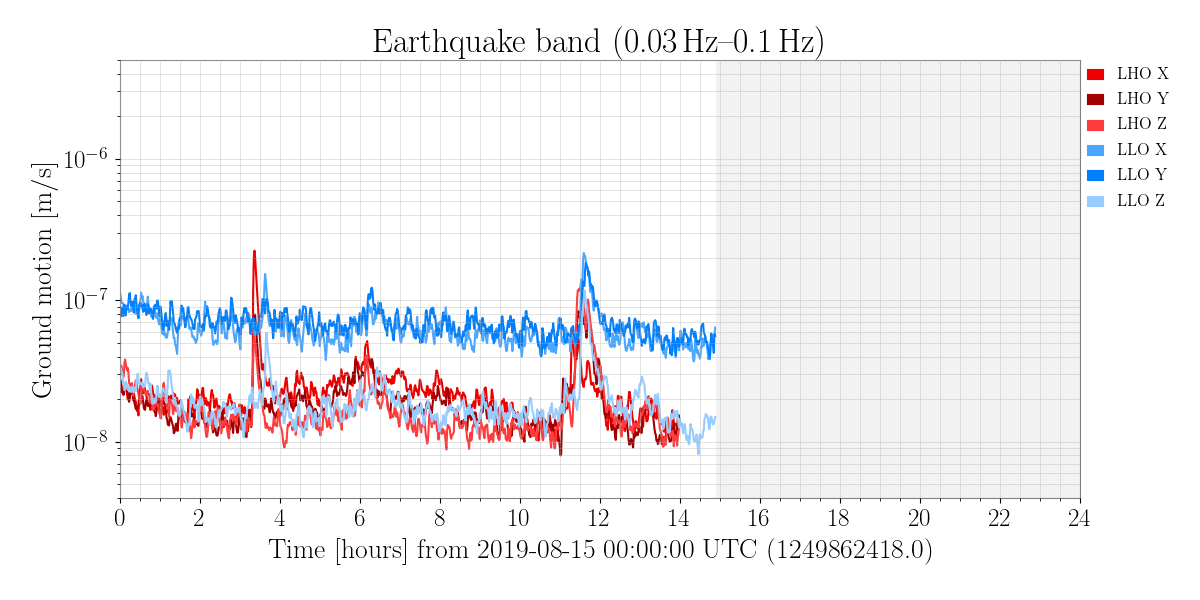
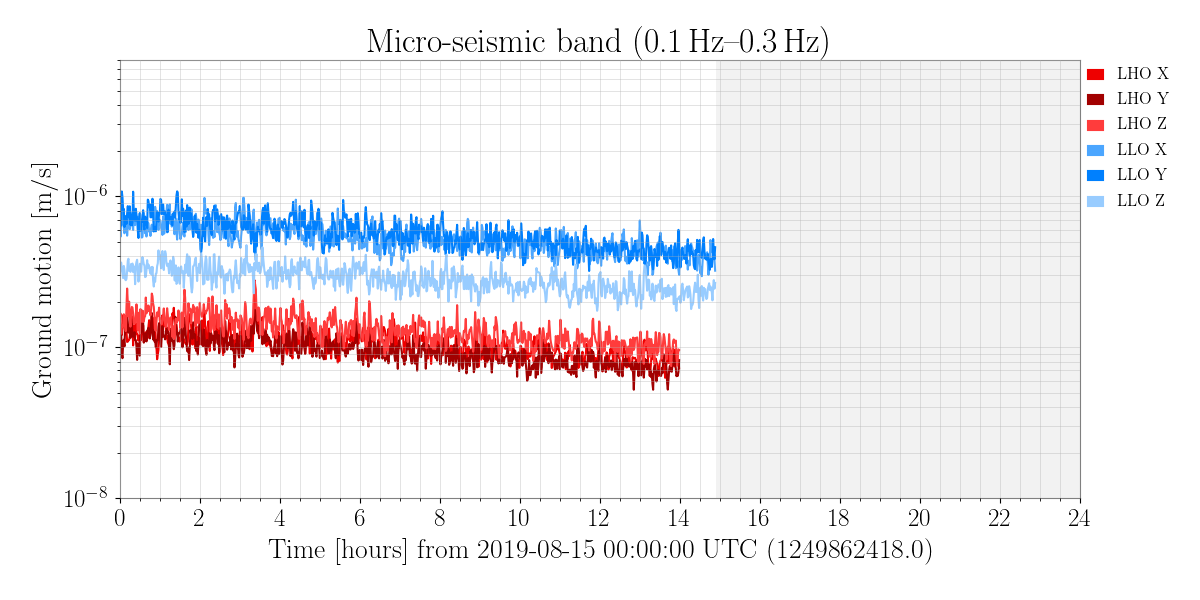
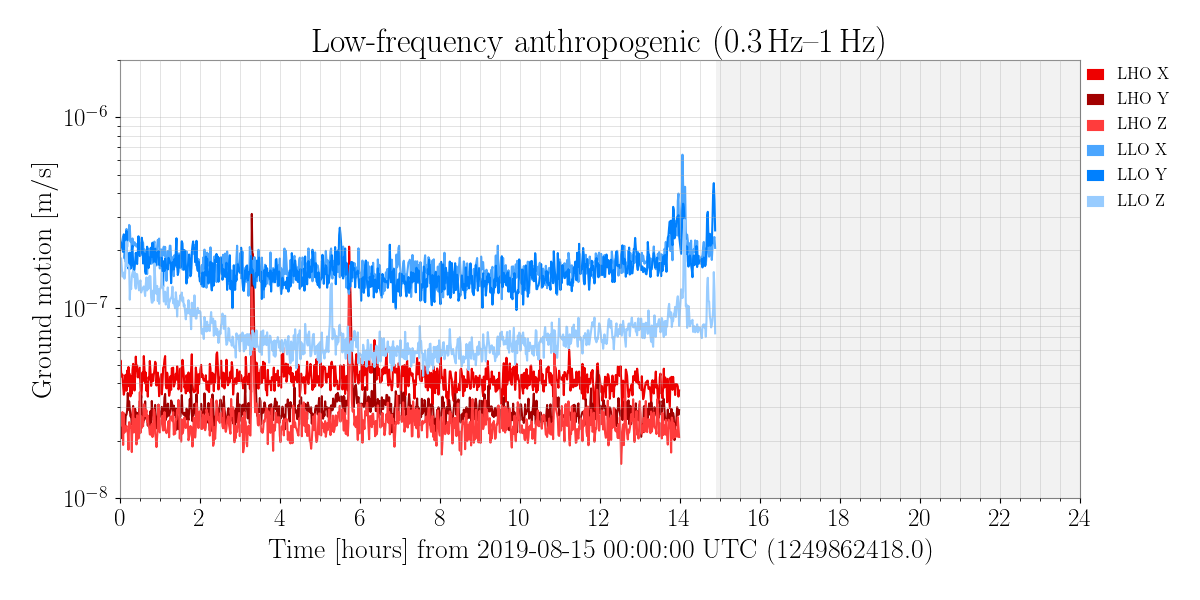
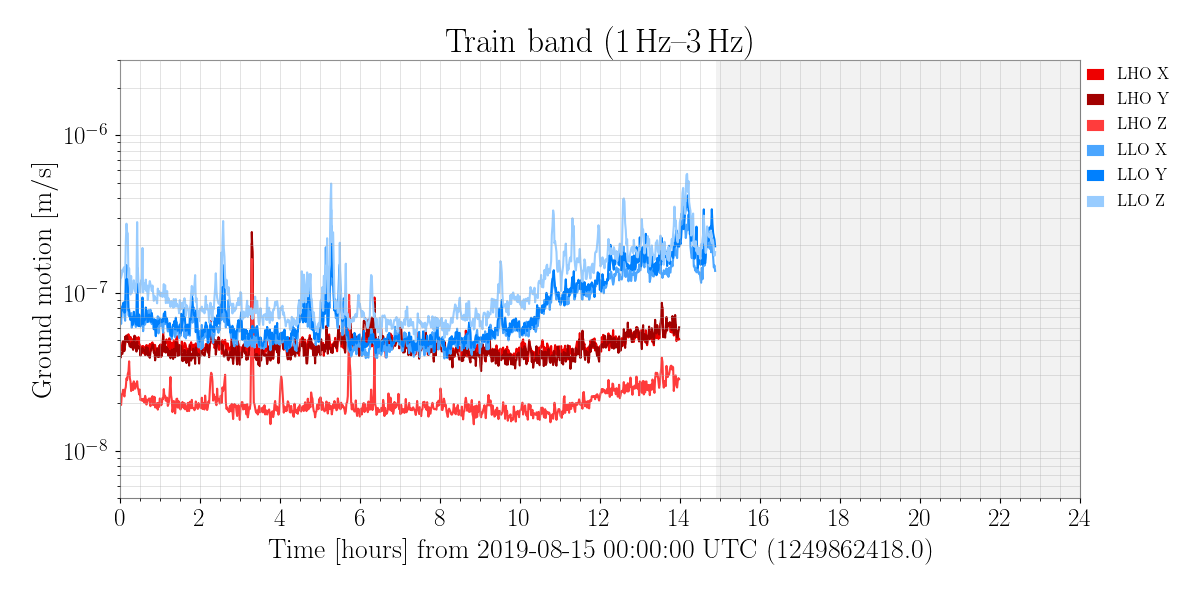
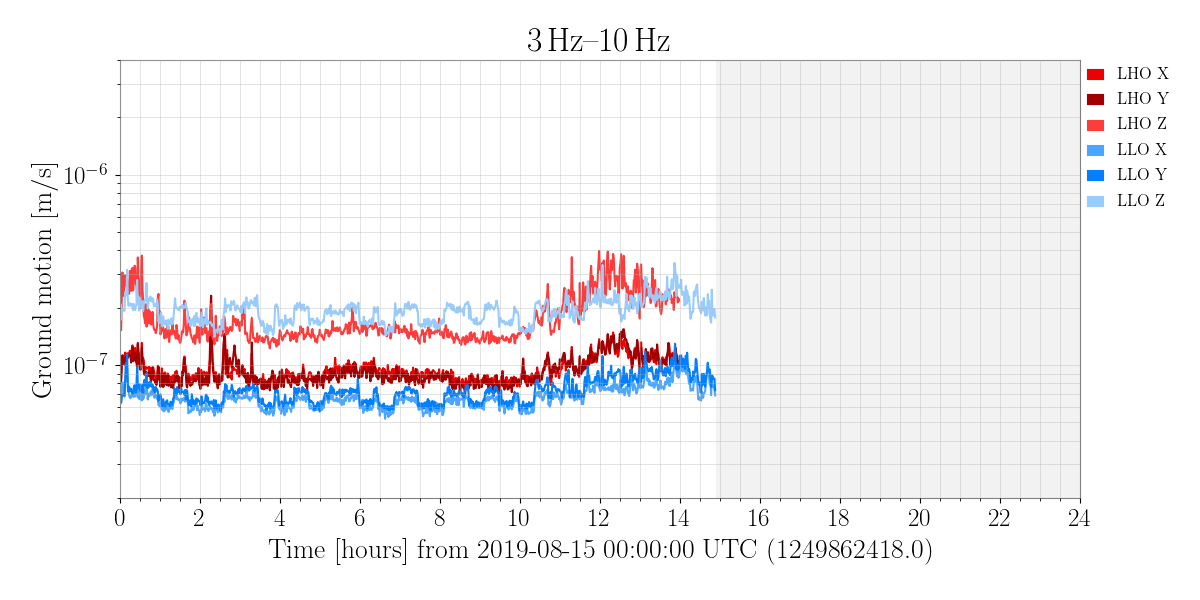
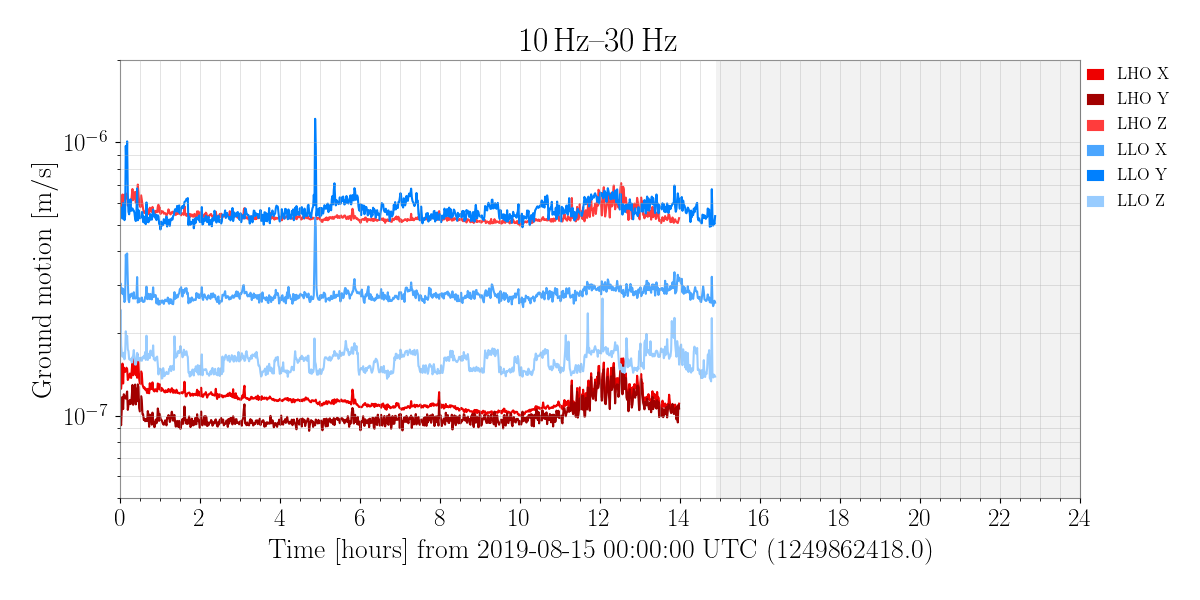
These plots display the ground motion at the LIGO Livingston and LIGO Hanford Observatories as measured by Streckeisen STS-2 seismometers at the corner station (where the X- and Y-arms meet). Each plot shows the root-mean-square ground motion in a different frequency band, which capture independent ground motion behavior.