Tutorial Step 3: Working with Data Quality
In this tutorial, we will take a look at how data quality information is stored in LIGO data files. If you are not already comfortable with using Python to read a LIGO data file, you may want to take a look at Step 2 of this tutorial.
What's Data Quality?
In addition to the main data output of the LIGO detectors (the "strain" channel), there are hundreds of other data channels that are recorded to monitor the state of both the instruments and the external environment. Some of these auxillary channels are used to create data quality flags to note times when the strain data is likely to be corrupted by instrumental artifacts. The data quality flags are organized into categories by how severe an impact they may have on a given type of search. The categories for each type of search are defined differently, but in general, a lower data quality category indicates a more severe problem. So, for example, a CBCLOW Category 1 flag means that a stretch of data is strongly corrupted and cannot be used to search for low-mass compact binary coalescence (CBC) signals, but a CBCLOW Category 4 flag indicates a less significant problem with the data.
For a more detailed explanation of the meaning of various flags, see the data documentation.
How is data quality information stored?
Data quality information is stored in LIGO data files as a 1 Hz time series for each category. Notice this is a different sampling rate than the 4096 Hz rate which is used to store strain data. So, for example, the first sample in a data quality channel applies to the first 4096 samples in the corresponding strain channel.
In the S5 data set, there are 18 data quality categories, as well as 5 injection categories, each represented as a 1 Hz time series. Let's print out a list of the S5 data quality channel names from the LIGO data file.
In the same directory where the data file you downloaded in
Step One, create a file named dq.py.
Inside dq.py, place the following code:
import numpy as np
import matplotlib.pyplot as plt
import h5py

filename = 'H-H1_LOSC_4_V1-815411200-4096.hdf5'
dataFile = h5py.File(filename, 'r')
gpsStart = dataFile['meta']['GPSstart'].value

dqInfo = dataFile['quality']['simple']
bitnameList = dqInfo['DQShortnames'].value
nbits = len(bitnameList)

for bit in range(nbits):
    print bit, bitnameList[bit]
Try running this code in the Python interpreter, either with
run dq if you are using Canopy or iPython, or
import dq and reload(dq) if you are not.
You should see a list of data quality category names. For an explanation of each category, see the data set documentation.
All the data quality categories are combined into a bit mask, and stored as an
array with 4096 entries (one entry for each second of data). In the LIGO data
file, this is called the DQmask, and you can extract it from the
LIGO data file by adding this code to dq.py:
qmask = dqInfo['DQmask'].value
Each sample in this bit mask encodes all 18 data quality categories as a
different digit in a binary number. A one in a particular digit means the
corresponding flag is "passed", so the data is "good" at that category level,
and a zero means the flag is off, so the data is "bad" at that category level.
For example, a DQmask value of
000000001000100011 in
S5 data would mean that the detector data
is available (DATA), and that the data passes the CBCHIGH_CAT1,
CBCLOW_CAT1, and BURST_CAT1 criteria, but fails all
other data quality conditions.
This is a compact way to store a lot of information, but to work with data quality, we'll want to put things in a more convienient form. Let's try to unpack some of this data quality information.
In most cases, you will not want to keep track of every data quality category,
but only a few values that are important for your search. For example, to
search for transient gravitational wave sources, such as supernovae or compact
object mergers, you may want to keep track of the DATA category,
as well as all of the BURST categories. As an example, let's try
unpacking just the BURST_CAT1 and DATA categories. Try adding this to
dq.py:
sci = (qmask >> 0) & 1
burst1  = (qmask >> 9) & 1
Now, the variable sci will be 0 everywhere the data fails the
DATA category, and 1 everywhere the data passes the
DATA category. Similarly, since BURST_CAT1
is stored in bit 9, the burst1 variable will correspond to this category. In a
typical case, you only want to use data where all of the categories of
interest are "passed", signaling relatively clean data. To accomplish this,
just take the logical, element-wise AND of all the channels you need:
goodData_1hz = sci & burst1
To confirm that goodData_1hz is on when both the DATA and
BURST_CAT1 categories are passed, we can make a plot of these three DQ
channels. Add the following to dq.py
plt.plot(goodData_1hz + 4, label='Good_Data')
plt.plot(burst1 + 2, label='BURST_CAT1')
plt.plot(sci, label='DATA')
plt.axis([0, 4096, -1, 8])
plt.legend(loc=1)
plt.xlabel('Time (s)')
When you run dq.py, you should see a plot of these three channels
that looks like this:
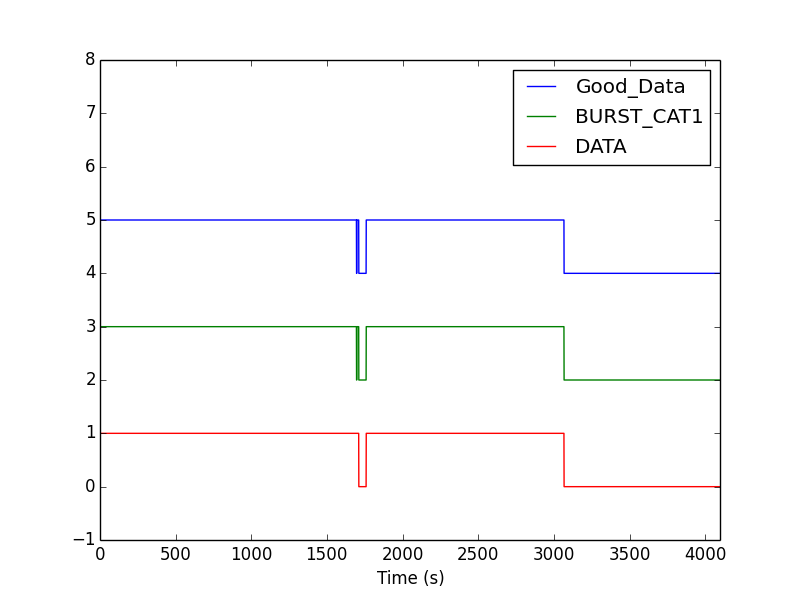
Here are some things to notice in the plot:
- The channels are off-set vertically so they can all be seen - each channel is either 0 or 1 at any time.
- A 1 means the category is passed, and so that second of data is good to use in your analysis.
- In this example, the "Good_Data" flag is the logical AND of the other two.
- The BURST_CAT1 flag is 0 for a short time around 1600 s into the file. You may need to zoom in on your plot to see this. So, there are 3 segments of "good data" in this file.
A convienient way to ignore periods of bad data is to use data quality segments in the form of a list of Python slices. These can be obtained like this:
dummy = np.zeros(goodData_1hz.shape)
masked_dummy = np.ma.masked_array(dummy, np.logical_not(goodData_1hz) )
segments = np.ma.flatnotmasked_contiguous(masked_dummy)
segList = [(int(seg.start+gpsStart), int(seg.stop+gpsStart)) for seg in segments]
We'll see examples of how to use segment lists in the next step.
You can see all the code described in this tutorial as dq.py here.
What's next?
- When you are comfortable with data quality information, you can go to the next step of this tutorial: Step 4: Using the example API