Tutorial: Find an Inspiral

[Image: NASA/CXC/GSFC/T.Strohmayer]
Gravitational-wave inspiral signals are expected from mergers of compact objects, including black holes and neutron stars. You can read more about these fascinating sources on LIGO.ORG or in a number of popular articles.
In this tutorial, we'll read in some simulated LIGO data that includes an inspiral signal, as well as a template for the signal. Then, we'll try a few different methods to extract the signal.
Read in the data and template
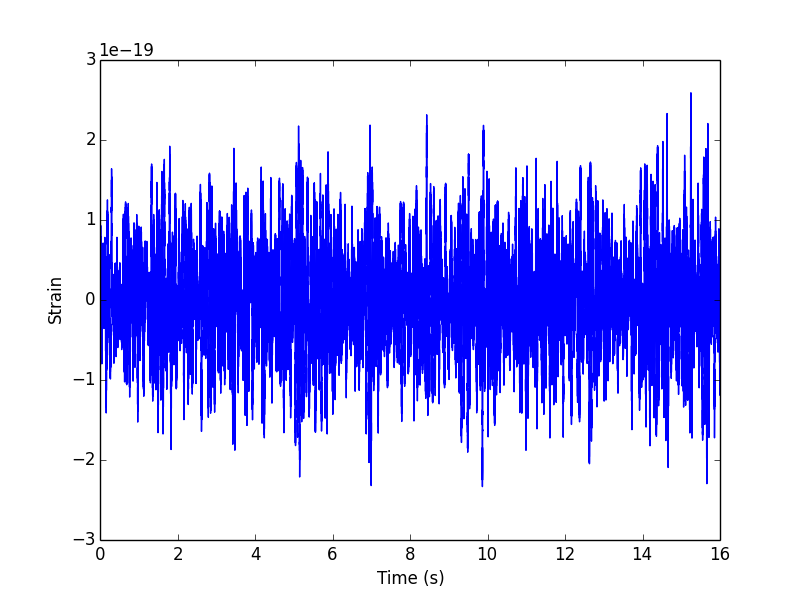
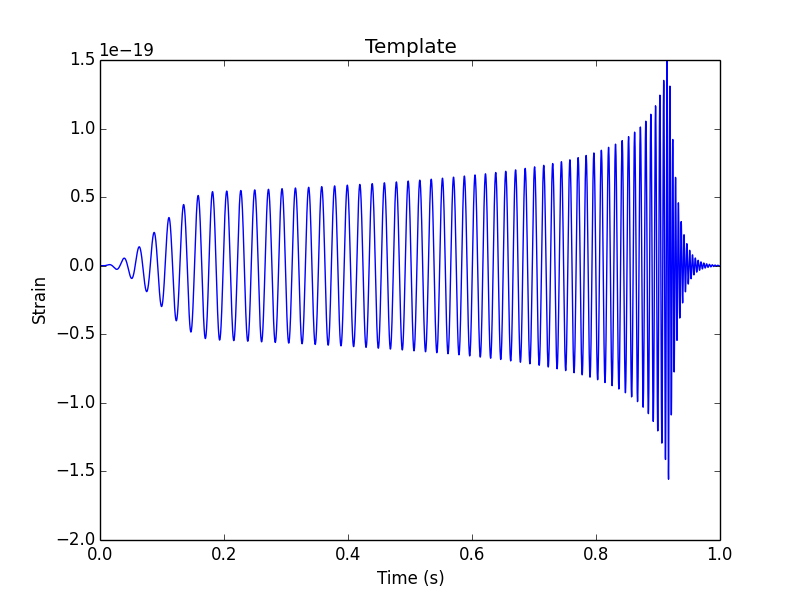
To get started, read in the data and template files, which can both be downloaded using the links in the yellow box above. Both the data and the template have a sampling rate of 4096 Hz. The data is 16 seconds of simulated, colored noise with a signal added somewhere in the first 12 seconds. The template is a 1 second inspiral-like signal. The template has been tapered at the beginning and end, so that it can be more easliy Fourier transformed.
# -- Import python data and plotting packages
import numpy as np
import matplotlib.pyplot as plt
import scipy.signal as sig
import h5py

# -- Read the data file (16 seconds, sampled at 4096 Hz)
fs = 4096
dataFile = h5py.File('data_w_signal.hdf5', 'r')
data = dataFile['strain/Strain'][...]
dataFile.close()
time = np.arange(0, 16, 1./fs)

# -- Read the template file (1 second, sampled at 4096 Hz)
templateFile = h5py.File('template.hdf5', 'r')
template = templateFile['strain/Strain'][...]
temp_time = np.arange(0, template.size / (1.0*fs), 1./fs)
templateFile.close()
The signal is somewhere in the first 12 seconds of the data file. Your task is to try and find out where.
To get an idea of what we are working with, let's plot the data and the template:
plt.figure()
plt.plot(time,data)
plt.xlabel('Time (s)')
plt.ylabel('Strain')

plt.figure()
plt.plot(temp_time, template)
plt.xlabel('Time (s)')
plt.ylabel('Strain')
plt.title('Template')
See the data | See the template
Once you are comfortable that you have read in the data, you can try 3 different methods for finding the signal: