Find an Inspiral: Bandpass filter
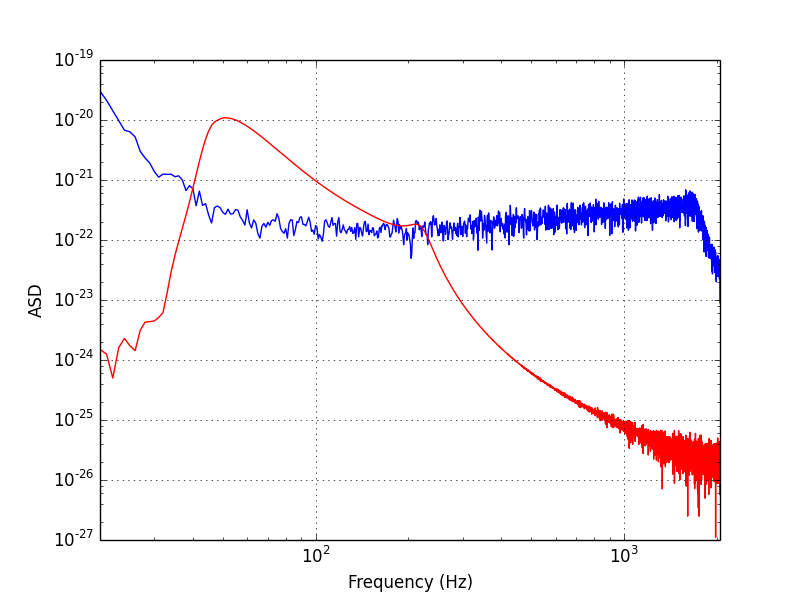
Plot an ASD for the data and the template
Can you see the signal in the data? Probably not. The signal amplitude is much smaller than the noise amplitude. However, it is possible to recover this signal because it has more power than the noise at some frequencies. To see which frequencies, try to plot an ASD of the template and the noise. You can assume the signal is only in the first 12 seconds of data, so you can use the last 4 seconds to make an ASD of just noise. The noise is simulated, colored Gaussian noise, high pass filtered with a 20 Hz cut-off. The tapering in the template effectively acts as a high-pass filter above 50 Hz. Between 50 and 200 Hz, the ASD of the template can be seen to fall with an f^(-7/6) power law, which is characteristic of inspirals. The "ringdown" can be seen as a small bump around 210 Hz.
You can see an example of how to plot an ASD in the Plot Gallery. If you really get stuck, you can also peak at the whole script described in this tutorial.
Once you plot your ASD, look to see which frequencies the template has the most power relative to the noise. You should see this is true for a range of frequencies near 100 Hz.
Apply a bandpass filter
We bandpass from 80 to 250 Hz, since we are looking for a signal in that frequency band and the detector noise is pretty low there. This will keep power in this frequency range, but suppress power away from this frequency. You can construct a butterworth bandpass filter like this:
(B,A) = sig.butter(4, [80/(fs/2.0), 250/(fs/2.0)], btype='pass')
data_pass = sig.lfilter(B, A, data)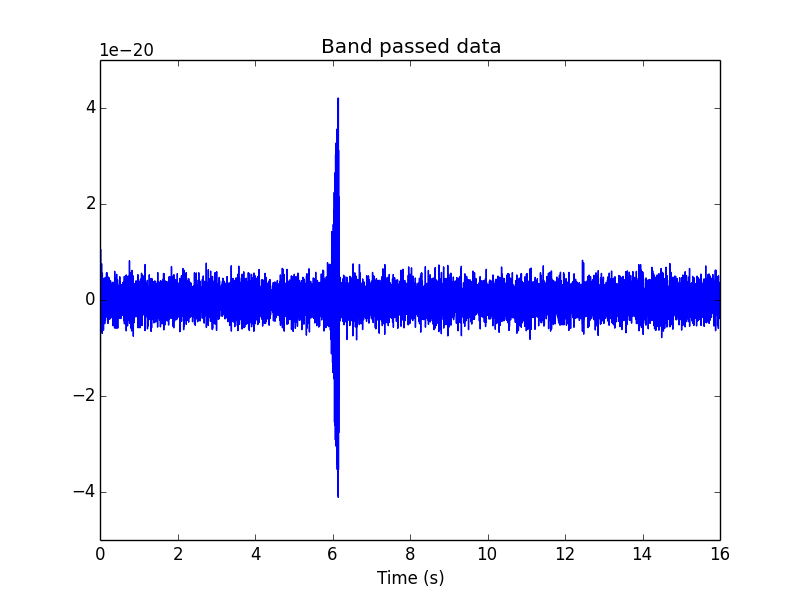
The passband for the filter is between 80 Hz and 250 Hz. Notice that the
passband has to be input as a fraction of the Nyquist frequency. Try plotting
data_pass, which is the data after applying the band-pass filter.
Do you see any evidence for the signal now? The peak occurs at the time when
the signal is loudest, near the end of the template.
What's Next?
- Go back to the Find an Inspiral tutorial.
- Try the next search method, the time domain cross-correlation.